
N-Body
Visualization
Framework


"Object-based" means that this is not the case where you're thinking of your data points as approximations to a continuous function, and what you really want to visualize is the continuous function (for example, volume visualization or contour plots). Instead, NVisF is for the case where the individual data points are themselves meaningful, and plotting them in a multidimensional space of the relevant variables reveals meaningful groupings and structures of data points. Doing this in 3-D instead of 2-D allows including an extra variable in the visualization.
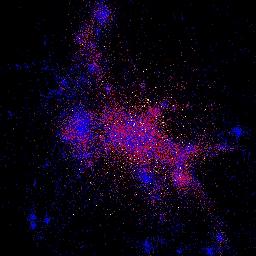
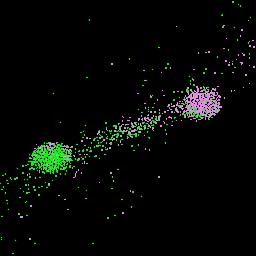
The simplest example application is the result of an N-body simulation giving the 3-D positions of particles. Plotting the full 3-D positions is much more powerful than trying to look at various 2-D slices. Adding color allows other variables to be simultaneously visualized.
There are more abstract applications. For example, in astronomy it is common to plot stars on a "color-magnitude" diagram - that is, a 2-D plot where one axis is the magnitude in a particular wavelength band, and the other axis is the magnitude difference between two bands. Here the "position" of the data point in the plot has nothing to do with a physical position, but the stars form a definite structure in this variable space that sheds light on the types of stars present. Extending this paradigm to 3 dimensions would add extra power to this technique.
Large is a key factor. Our largest N-body simulations currently include 10^8 particles, and we envision future calculations with as many as 10^9 particles. Publicly available software cannot handle such large data sets; indeed, it is certain that this goal can only be achieved within a parallel processing environment. A primary objective of this research is to produce an architecture that fulfills this need.
Another key objective is to produce a framework for these kinds of visualizations, as part of the larger N-Chilada project that will combine similar frameworks for the tasks of designing the simulations, running them, and analyzing the output. Put simply, an object-oriented framework combines (i) an abstract definition of how to solve the problem, and (ii) a concrete modular implementation of that solution. This design provides two powerful advantages. First, if you decide you want to approach the problem in a different way, it is exceedingly clear what parts of the code need to change. Second, if someone comes up with a better (or simply different) implementation of one part of the solution, it can be seamlessly combined with the other parts, allowing rapid improvements in performance and functionality.
It is difficult to overstate the significance of these two advantages. During the design of the packages, on several occasions we changed our minds about how to approach one part of the problem. Within the framework, it was simple to completely redesign one package while requiring only a few easily identified changes to the other packages. Similarly, when new data sets with new file formats were presented, it was quite easy to write a new file reader that integrated with the rest of the framework, providing immediate extension of the system to a new type of data.
To summarize, the key features of the N-Body Visualization Framework are:
Several demo applications are provided with this release. One visualizes a single data set with 10^5 particles, while another displays a movie of 75 frames, each with 2000 particles. These applications were run on a 400mHz Pentium Linux box with a fast video card (Matrox Millenium G400). The 10^5 particle visualization has quite smooth zooming and rotation, although tests with a larger 10^6 particle data set were noticeably sluggish in performance (in both cases, the data points were rendered as indivual pixels). For the movie, performance was excellent at 10fps when rendering the objects as individual pixels. Some tests were done in which the particles were rendered with wire-frame polygons or solid spheres. In these cases performance was significantly reduced, although acceptable animation was still possible with 2-5 fps.
This release is essentially a proof of concept, plus a study of the issues involved. It is certain that major components of the system will change in future releases, especially when it is integrated with the parallel framework of N-Chilada. However, the current version is useful in it's own right, and it is hoped that allowing others to examine the system will lead to constructive feedback.
Check the links below for documentation and downloads.